Google Chartを使ってみる
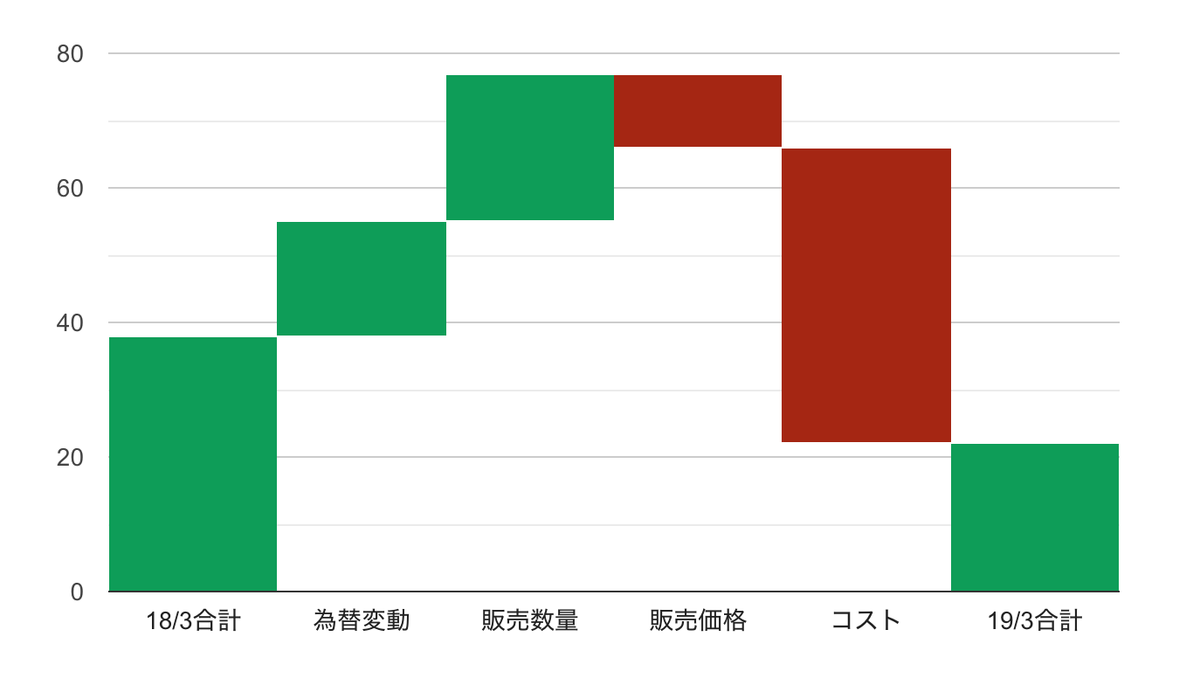
Waterfallチャートを作りたくてここ数週間、色々なJavaScriptのチャートライブラリを試していました。
選考条件としては
- チャートタイプやサンプルの豊富さ
- Stackoverflowでの質問数
- Vue向けのWrapper Libraryがある
です。
下記の参考リンクなどから調査した結果、Google Chartsに結局落ち着きました。 公式のサンプルの豊富さが決め手でした。
作ってみてわかったのですが、実はWaterfallチャートはCandlestick chartの派生というか、実質同じものでした。
Waterfall charts With the right set of options, candlestick charts can be made to resemble simple waterfall charts. https://developers.google.com/chart/interactive/docs/gallery/candlestickchart
Vue.js wrapperであるvue-google-chartsを使ったサンプルは下記の通りです。
GitHub - devstark-com/vue-google-charts: Reactive Vue.js wrapper for Google Charts lib
<template>
  <GChart
    type="CandlestickChart"
    :data="chartData"
    :options="chartOptions"
    style="width: 900px; height: 500px;"
  />
</template>

<script>
  import {GChart} from 'vue-google-charts'
  export default {
    name: "Waterfall",
    components: {
      GChart
    },
    data() {
      return {
        chartData: [
          ['','','','','',],
          ['18/3合計', 28, 0, 38, 38],
          ['為替変動', 38, 38, 55, 55],
          ['販売数量', 55, 55, 77, 77],
          ['販売価格', 77, 77, 66, 66],
          ['コスト', 66, 66, 22, 22],
          ['19/3合計', 22, 0, 22, 22],
        ],
        chartOptions: {
          legend: 'none',
          bar: { groupWidth: '100%' }, // Remove space between bars.
          candlestick: {
            fallingColor: { strokeWidth: 0, fill: '#a52714' }, // red
            risingColor: { strokeWidth: 0, fill: '#0f9d58' }   // green
          }
        }
      }
    }
  }
</script>

<style scoped>

</style>

参考リンク
Candlestick Charts | Charts | Google Developers
GitHub - vuejs/awesome-vue: 🎉 A curated list of awesome things related to Vue.js